How are you resolving misconfigurations or AWS network issues in your AWS? How much time do you spend on an average while debugging issues? If it’s more than an hour, you probably are using a wrong tool!
Humans are visual by nature. A major research states that a human brain process images 60,000 times faster than text. In addition, 90 percent of information transmitted to the brain are visual. So, visual cues help debug any misconfiguration faster when compared to tabular or dashboard-styled debugging tools. Even in the most `hyper-complex cloud environment.
Plus, cloud provider’s new services bring in more abstraction. Such services might hide elements from a network layer on top of them. So, to contextually understand resource connection or to understand these resource performance in granularity, a visual console is more appropriate.
Take for instance — you want to check resources’ connection inside a VPC. To this end, using a tabular format or several dashboards is cumbersome. Tools like cloud mapper do provide a topology view but these services cannot provide end-to-end context of things at multiple levels. Whereas, a visual console that can map and show live relations between resources can help you understand the entire topology; plus, save you lots of effort.
To demonstrate this, let’s consider a simple web server architecture as shown below. The architecture is basic with an instance and few S3 buckets across two regions.
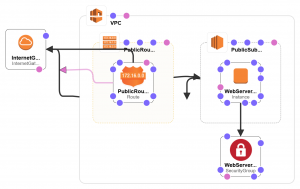
For an architecture as simple as this, finding all the subnets in a region and the resource relationships in a tabular format or a dashboard is challenging. As the application’s complexity scales up, so does its architecture.
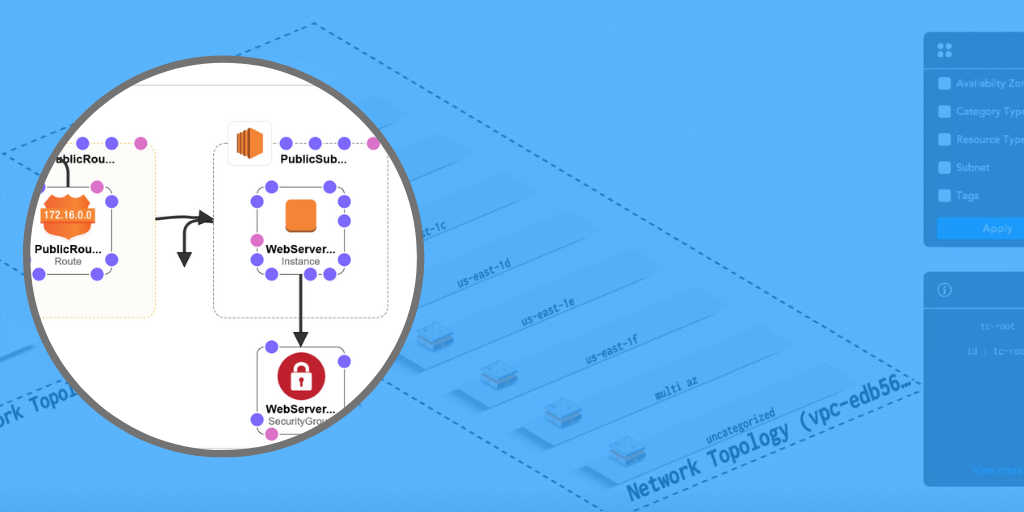
Here’s a video of TotalCloud Network View of the same architecture. TotalCloud’s interactive visual console shows all the subnet distribution and relationship between the resources on a single pane.
From the above video you can observe that an immersive visual console helps you understand any architectures easier. In fact, 100X faster, compared to tabular or visualization dashboards. And for a dynamic environment like AWS, such a view provides complete cloud visibility.
Apart from watching all the subnets, you can even drill down further to each subnet to check if Route Tables and NACLs are configured right. This demonstrates a focused view of the network. This helps you overcome AWS design failures and identify any blind spots present, at multiple levels, in seconds.
Maintaining a well-configured AWS network is a cloud user’s responsibility. TotalCloud helps realize it effortlessly with its focused view, rapid live debugging feature, and rich topology visualizations.
If you are looking to understand AWS Security posture at a glance, read this post.

.png)
.png)
.png)
.png)
.png)